
← Discover MetrixAsk a better question.
ANALYSIS
Ask a better question.
See a clearer pattern.
Explore groups, relationships and change over time. Metrix turns the records you already hold into comparisons you can investigate.
CURVED RELATIONSHIPS
[ LOOK DEEPER ]Beyond a straight lineCurved trend analysis
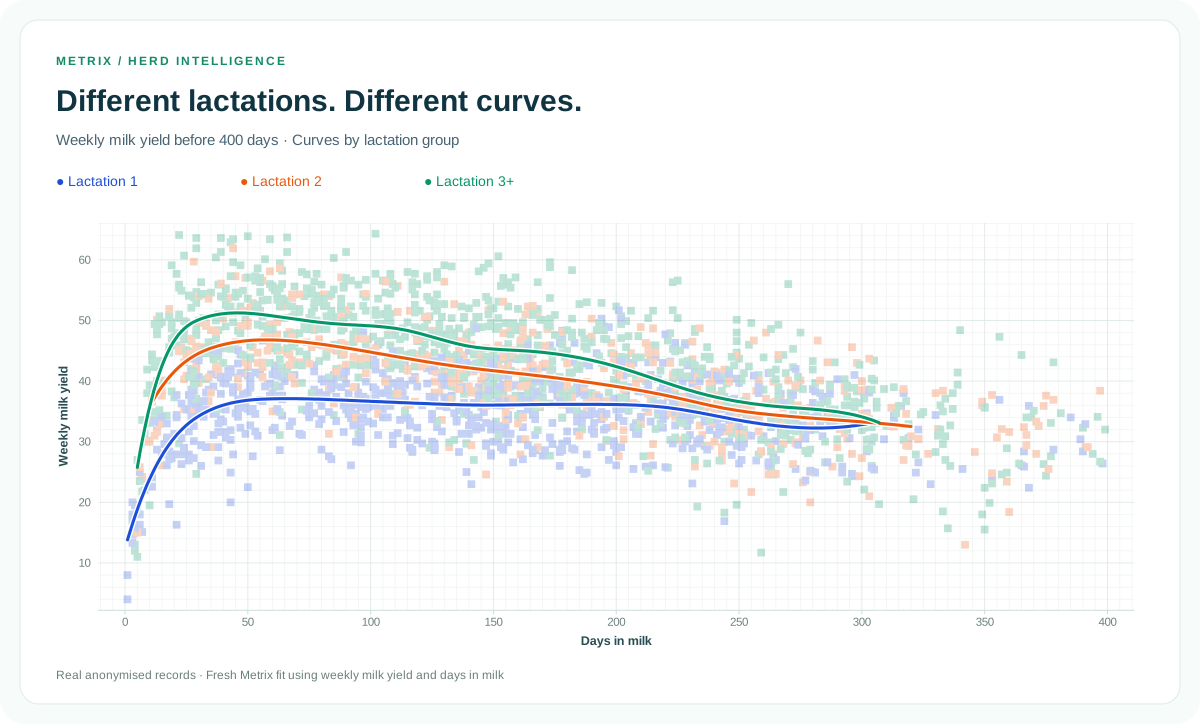
The average is a start.
The pattern goes deeper.
Compare calving and birth cohorts, split groups by lactation, and explore how outcomes change with days in milk. Use Curved trend analysis to examine curved relationships, with different fitting methods available for different questions.
- Calving, birth and test-day cohort analysis
- Curved trend analysis for nonlinear relationships
- Model explanations, assumptions and input-quality information
COHORT ANALYSIS
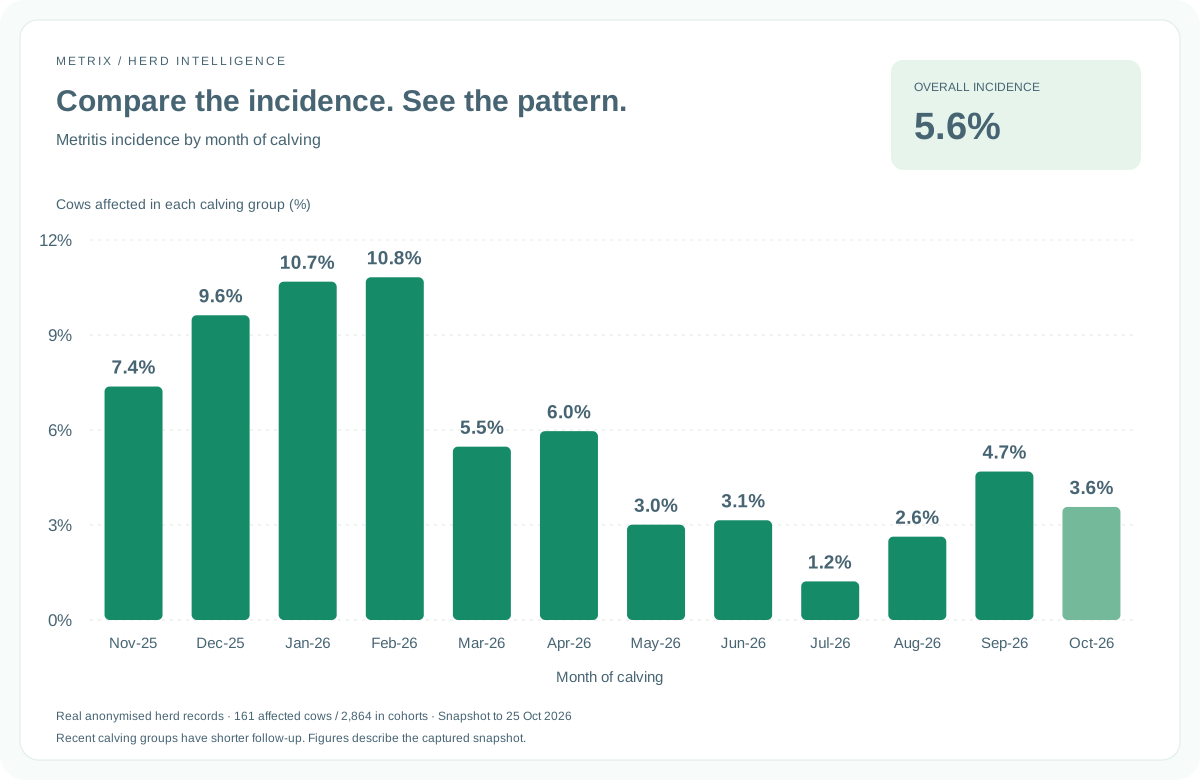
A shared starting point.
A clearer comparison.
Group animals by when they calved, were born or were milk recorded. Compare the outcomes of groups that share a starting point, rather than relying only on a whole-herd average.
YOUR DAILY OVERVIEW
Live dashboards.
A starting point for deeper insight.
Keep key figures together, then follow linked tiles into the reports behind them.
Explore the dashboard examples ↗Keep exploring Metrix
Explore reproduction analysis Back to the overview